X-Ray Inspection of Lead and Lead-Free Solder Joints
ABSTRACT
X-rays are widely used to inspect solder joints in the electronics industry. Environmental concerns related to the impact of lead waste led the electronics industry to reduce or eliminate the use of lead in their manufacturing processes in 2007. Due to reliability concerns related to the use of lead-free solders in mission critical products, military and aerospace companies have been temporarily exempt from this requirement. However, as the availability of commercially available lead parts becomes scarce, some of the companies in the aerospace and military markets are considering the use of lead-free parts.
As aerospace companies consider the shift to lead-free solder alloys and glues, concerns have been raised about whether their current X-ray inspection and quality-control procedures will still be valid. With lead solder, joints are easily interpreted by the operator or the system imaging software because lead provides excellent image contrasts due to relatively high X-ray absorption compared to that of PCB and component materials. Will this hold true as they shift to lead-free solder compounds?
In this paper, we study how the physics of X-ray requires the change of settings and procedures for an accurate inspection. The atomic number of a material (Z) drives its X-ray absorption. Materials with high Z absorb more X-rays than materials with low Z. Tin (Z = 50), for example, is a common material found in lead-free solders. Lead, on the other hand, has atomic number 82. This difference in atomic numbers—and the different alloys present in the market today—may drive the need to change the settings and modes of the X-ray inspection system to match the chemistry of the solder joints. An accurate X-ray technique can only be achieved once the imaging system can produce similar contrast for both lead and lead-free solder inspection.
INTRODUCTION
It has been over a decade now since environmental concerns over contamination due to lead waste led the electronics industry to migrate solder processes away from the usage of eutectic tin-lead solder and towards utilization of lead-free compounds. Such a process change had several ramifications. The first major impact in the industry was the initial investment in equipment and materials to adapt to RoHS requirements. Another critical impact was the necessity to redesign reflow processes to bring the new assemblies with lead-free solders to an equivalent yield as the industry experienced prior to the migration to lead-free.
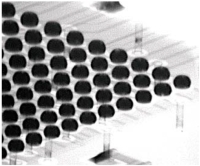
Although most companies have successfully moved to lead-free SMT lines, a considerable portion of manufacturers working in aerospace and military programs are still required to use lead solder. These companies routinely use X-ray inspection systems to assess and validate the quality of their assemblies. However, an X-ray inspection system will only be useful in a lead-free world if the changes in solder compounds do not have a significant deleterious effect on its imaging characteristics. To mitigate the concerns related to the inspection migration from lead to lead-free solder, in this paper we provide theoretical and practical studies of some of the effects of lead-free solder on an X-ray imaging capability. This is done primarily by comparison of X-ray attenuation properties for eutectic tin-lead solder and various lead-free solder compounds. We additionally show both actual images of solder joints made with lead and lead-free solder pastes. The conclusion of this analysis is that we found little contrast variation when using lead-free solders, which implies little change in inspectability.
X-RAY GENERATION AND ATTENUATION
X-rays have been used for non-invasive high-resolution imaging of industrial and biological specimens since their discovery in 1895. Recently, a number of new contrast methodologies have emerged which are expanding X-ray's applications to functional as well as structural imaging. Figure 1 shows how the interaction of the X-ray photon with the atom inside the sample are leveraged by the different X-ray inspection techniques.

Figure 1: PTH process window by alloy.
X-rays are generated by accelerating electrons across a high voltage to collide with an anode composed of a high atomic number, high melting point material (commonly tungsten). Interactions between the electrons and the tungsten anode lead to the production of X-rays with a broad energy spectrum. The maximum energy of the X-ray spectrum is determined by the voltage applied in the X-ray tube. As tube voltage increases, the mean X-ray energy and number of photons produced both increase. This is demonstrated in Figure 2A for a tungsten anode operating at two different voltages: 80 and 140kV. The energy of the produced X-rays is an important determinant of their absorption by a given material. This energy spectrum can be modified by filtration through metal filters. Filtration is primarily used to increase the mean energy of the X-ray spectrum by removing low energy photons. Filtration can be used to both reduce radiation dose and improve image quality, and filtration can be optimized depending on the imaging[1]. Microfocus X-ray tubes used in high-end X-ray inspection machines have a small focal spot (area where the electron beam interacts with the anode), which reduces the source function blur (i.e., penumbra blurring) and thereby greatly improves the maximum image resolution. This increased resolution is necessary for imaging small features in electronic assemblies.

Figure 2: X-ray production and attenuation. (A) X-ray energy spectra produced at two different tube voltages: 80 and 140kV. Both the number of photons produced and the mean energy of the spectrum increases with higher voltage. (B) X-ray attenuation as a function of X-ray energy for multiple materials. In general, the X-ray attenuation rapidly drops with increasing X-ray energy. At the K-edge of each material, there is a sharp rise in attenuation due to the photoelectric absorption at that energy.
X-rays travel from the focal point of the X-ray tube, through the subject, and on to the X-ray detector. The X-ray detector measures the relative amount of X-rays absorbed by the subject at any given position. X-ray attenuation is given by

where I is the intensity of the X-rays transmitted through the subject, I0 is the original intensity of the X-rays incident on the object, μ is the linear attenuation coefficient of the object, and x is the thickness of the object, as seen also in Figure 3.

Figure 3: X-ray photons passing through a homogeneous attenuating (μ) material of constant thickness (x).
Therefore, absorption of X-rays by a material is dependent on the thickness of the material and on the material-dependent attenuation coefficient. Diagnostic X-rays can be absorbed by a material via two primary mechanisms: Compton scattering and the photoelectric effect.
Compton scattering occurs when an X-ray photon collides with an outer shell electron within the subject. Upon collision, the electron absorbs a portion of the X-ray energy and is ejected from the atom. The X-ray photon is deflected from its original direction and loses some energy. This scattering can occur in all directions and can lead to noise at the detector. The amount of Compton scattering that occurs within an object depends primarily on the energy of the incident X-ray photon and the density of the object. Compton scattering decreases slightly with increasing photon energy, so higher energy X-rays are better able to pass through a sample without attenuation. The density of outer shell electrons increases with the mass density of a material, so denser materials tend to have more Compton scattering and therefore more X-ray attenuation.
The photoelectric effect occurs when an X-ray photon transfers all of its energy to an inner shell electron within the subject. This electron is ejected from the atom and its vacancy is subsequently filled by an outer-shell electron, which leads to the release of a secondary photon. The photoelectric effect is highly dependent on both the energy of the incident X-ray and the atomic weight of the object. The photoelectric effect is strongest when the X-ray energy matches the binding energy of the inner-shell electrons. As X-ray energy increases, the likelihood of the photoelectric effect drops rapidly, proportional to the inverse cube of the X-ray energy (1/E3). If the X-ray energy is below the energy of a particular electron shell, then none of those electrons can participate in the photoelectric effect because the X-ray does not have enough energy to overcome the electron binding energy. This leads to the K-edge effect, where the probability of absorption due to the photoelectric effect jumps abruptly as the X-ray energy increases above the K shell electron binding energy. The photoelectric effect is also proportional to the cube of a material’s atomic number (Z3), so high atomic weight materials exhibit a much stronger photoelectric effect than low atomic weight materials. This is why contrast agents for CT traditionally include high atomic weight elements (e.g., iodine, barium). The K-edge effect is shown in Figure 4, which demonstrates the relative probability of X-ray photon attenuation at different X-ray energies for several high Z materials commonly found in lead and lead-free solder compounds.

Figure 4: Mass attenuation coefficients for various elements as a function of X-ray photon energy. Note the dominance of the photoelectric cross-section, followed by the Rayleigh and Compton cross-sections.
Many factors affect the attenuation of X-rays as they pass through a material. These “factors” are summarized in terms of a number of parameters known as scattering cross-sections, which may be loosely thought of as an effective capture area over which an X-ray photon experiences some type of scattering event. X-ray photons experience a variety of scattering interactions, including photoelectric, Compton, pair production, Rayleigh, and photonuclear[2]. For the energy range in which the X-ray machine used in these experiments operates, photoelectric interactions are predominant, followed by Rayleigh and Compton. The parameter that provides all the information necessary to predict bulk attenuation properties is known as the attenuation coefficient. Scattering cross sections and attenuation coefficients have been measured for the elements and are readily available[3,4].
Lead, for example, has a linear attenuation coefficient μ = 26.43 cm-1 for 80keV X-rays. (80keV is the middle of the energy spectrum in the TruView FUSION 150kV.) Thus, 1mm of lead reduces transmitted intensity to 7.1% of the incident intensity. The ability of a material to attenuate the X-rays produced by the X-ray machine depends primarily on three factors: 1) its atomic number, 2) its density, and 3) the frequency of the radiation. The photoelectric cross-section depends on these three factors approximately as

for hν below 100keV, where τ is the photoelectric cross-section, ρ is the density, Z is the atomic number, ν is the radiation frequency, and h is Planck’s constant. This expression indicates why lead and other high Z materials are such good attenuators of lower energy X-rays. Rayleigh scattering behaves as

and Compton scales roughly with the density. The attenuation coefficient is obtained by summing the scattering cross-sections. X-rays are generated by the source by rapidly decelerating high energy electrons. This process leads to radiation known as bremsstrahlung. Unfortunately, bremsstrahlung radiation is not monochromatic. We must therefore make a modification to Equation 1 in order to obtain a more accurate representation of total attenuation. Since the X-ray source is naturally incoherent, we do this by integrating Equation 1 over the energy spectrum. If we let p(E) denote the fraction of the spectrum with energy E, then we have

where Emax is the maximum energy in the spectrum, which is 150keV for the X-ray machine used in this paper.
TIN-LEAD SOLDER VS. LEAD-FREE SOLDERS
There are a number of lead-free solder compounds in the market today. For examples in this analysis we used some of the solder compounds discussed in [5]. In particular, we compare eutectic tin-lead solder (63Sn/37Pb), tin-bismuth (42Sn/58Bi), and a variety of predominantly tin based solders, including tin-silver (98Sn/2Ag), tin-antimony (95Sn/5Sb), tin-indium-silver (77.2Sn/10In/2.8Ag), and tin-silver-copper (96.3Sn/3.2Ag/0.5Cu).
Solder compounds can be classified according to those he deems most likely lead-free alternatives, all of which have at least 95% Sn content[5]. In our analysis, we consider three of these (98Sn/2Ag, 95Sn/5Sb, and 96.3Sn/3.2Ag/0.5Cu). The others are provided for comparison purposes. Equation 4 must be discretized for evaluation. Using a Creative Electron’s proprietary emulation and simulation software, we computed the energy spectra and attenuation coefficients for 16 bands of 10keV width spanning 10keV to 160keV. Equation 4 in discrete form then becomes:

Using this data and accounting for filtration due to the X-ray source anode materials, we obtain values for all p(Ei ). The results are summarized in Figure 5. In Figure 6 we provide the stopping power (i.e., 1-I/I0) for five lead-free solder compounds and eutectic tin-lead solder at thicknesses of 2 mil, 5 mil, 10 mil, and 20 mil. The stopping power indicates the relative amount of X-rays that are attenuated in the material. For example, a stopping power of 0.75 means that three-quarters of the incident radiation is attenuated. Higher numbers consequently imply higher attenuation.

Figure 5: Energy spectrum of a TruView FUSION with a 150kV microfocus X-ray source.

Figure 6: Attenuation of lead-free solders and eutectic tin-lead solder. Note that the amount of attenuation at different material thicknesses is similar.
X-RAY IMAGE ANALYSIS
To validate the analysis presented in the previous session our Advanced Technology Group inspected a wide range of samples with both lead and lead-free solder composites. We compared eutectic tin-lead (63Sn/37Pb) and tin-bismuth (42Sn/58Bi) solders for their imaging profile using a TruView FUSION running at a maximum of 150kV. As expected, the X-ray images obtained from the samples using both types of solder did not present a notable difference. Please note that it is not the focus of this paper to compare the overall performance between lead and lead-free solders. Instead, the objective of this analysis is to validate that the X-ray machine settings work for both lead and lead-free solders.

Figure 7: Gullwing solder joints using both lead and leadfree solder paste. Note that the lead-free solder is slightly lighter (less dense) than the lead solder joint.

Figure 8: Through-hole vias filled with lead and lead-free solders. At this density, it’s hardly noticeable any difference between the two solder technologies.

Figure 9: BGA assembled using lead-free balls and paste with opens and head-in-pillow (HIP) defects. These assembly issues can be caused by erroneous temperature reflow profiles.

Figure 10: Lead-free solder BGA with several of its balls showing excessive voiding. The tear-shape of some of the balls suggests that some of the solder is flowing towards the through-hole vias, an indication of potential issues with the board’s soldermask.

Figure 11: Oblique view of several balls in a BGA assembly using lead solder.

Figure 12: Oblique view of a BGA assembled using lead-free solder. Note the size and shape of the balls in the first row. The balls on the left are correctly connected, while the balls on the last column in the right are either open or head-in-pillow (HIP). This side view indicates a planarity problem with this assembly, which means that the BGA must be removed and reworked.

Figure 13: Lead solder BGA with several of its balls showing excessive voiding which indicate that this part should be reworked. The irregular shape of some of the balls suggests irregular reflow.

Figure 14: Lead-free solder BGA with several of its balls showing excessive voiding which indicate that this part should be reworked.
CONCLUSIONS
In this paper, we demonstrated some effects on an X-ray inspection system the imaging characteristics for a few of the lead-free solders. A theoretical analysis based upon X-ray attenuation characteristics showed that there is almost no difference between eutectic tin-lead solder and 42Sn/58Bi. We also determined that predominantly Sn based solders lead to a contrast about 88% of that for eutectic tin-lead solder. Consequently, we expect little variation in the inspectability of joints made with these alternative solders. We additionally provided some images of real solder joints constructed with these different compounds. These images showed the expected contrast variations.
Although the analysis performed in this paper does not constitute a rigorous proof, it indicates that usage of a number of lead-free solders should not seriously degrade the X-ray inspection imaging capability.
REFERENCES
1. Hupfer, M., Nowak, T., Brauweiler, R., Eisa, F., and Kalender, W.A. (2012). “Spectral optimization for micro-CT”. Med. Phys.39, 3229–3239.
2. Attix, Frank H. “Introduction to Radiological Physics and Radiation Dosimetry”. John Wiley & Sons, New York, 1986.
3. Cullen, D. E., et. al. “Tables and Graphs of Photon-Interaction Cross Sections Derived from the LLNL Evaluated Photon Data Library (EPDL), Z=1-50”. Lawrence Livermore National Laboratory, Livermore, CA, Vol. 6, Part A, Rev. 4, 1991.
4. Cullen, D. E., et. al. “Tables and Graphs of Photon-Interaction Cross Sections Derived from the LLNL Evaluated Photon Data Library (EPDL), Z=50-100”. Lawrence Livermore National Laboratory, Livermore, CA, Vol. 6, Part B, Rev. 4, 1991.
5. Bastecki, Chris. “A Benchmark Process for the Lead-Free Assembly of Mixed Technology PCBs”. Technical Brief, Alpha Metals Inc., January 1997.
Editor's Note: This paper was originally published in the proceedings of SMTA International, 2016.